SIGNAL
AI Business Intelligence Platform
Ask your business data questions in plain language.
Let anyone ask why a number moved and get an answer that names the segment responsible.
- Semantic layer
- Query compilation
- Contribution analysis
- Row-level policy
- Forecast intervals
Natural-language analytics over a governed semantic layer, with anomaly detection and forecasting that explain themselves rather than just alerting.
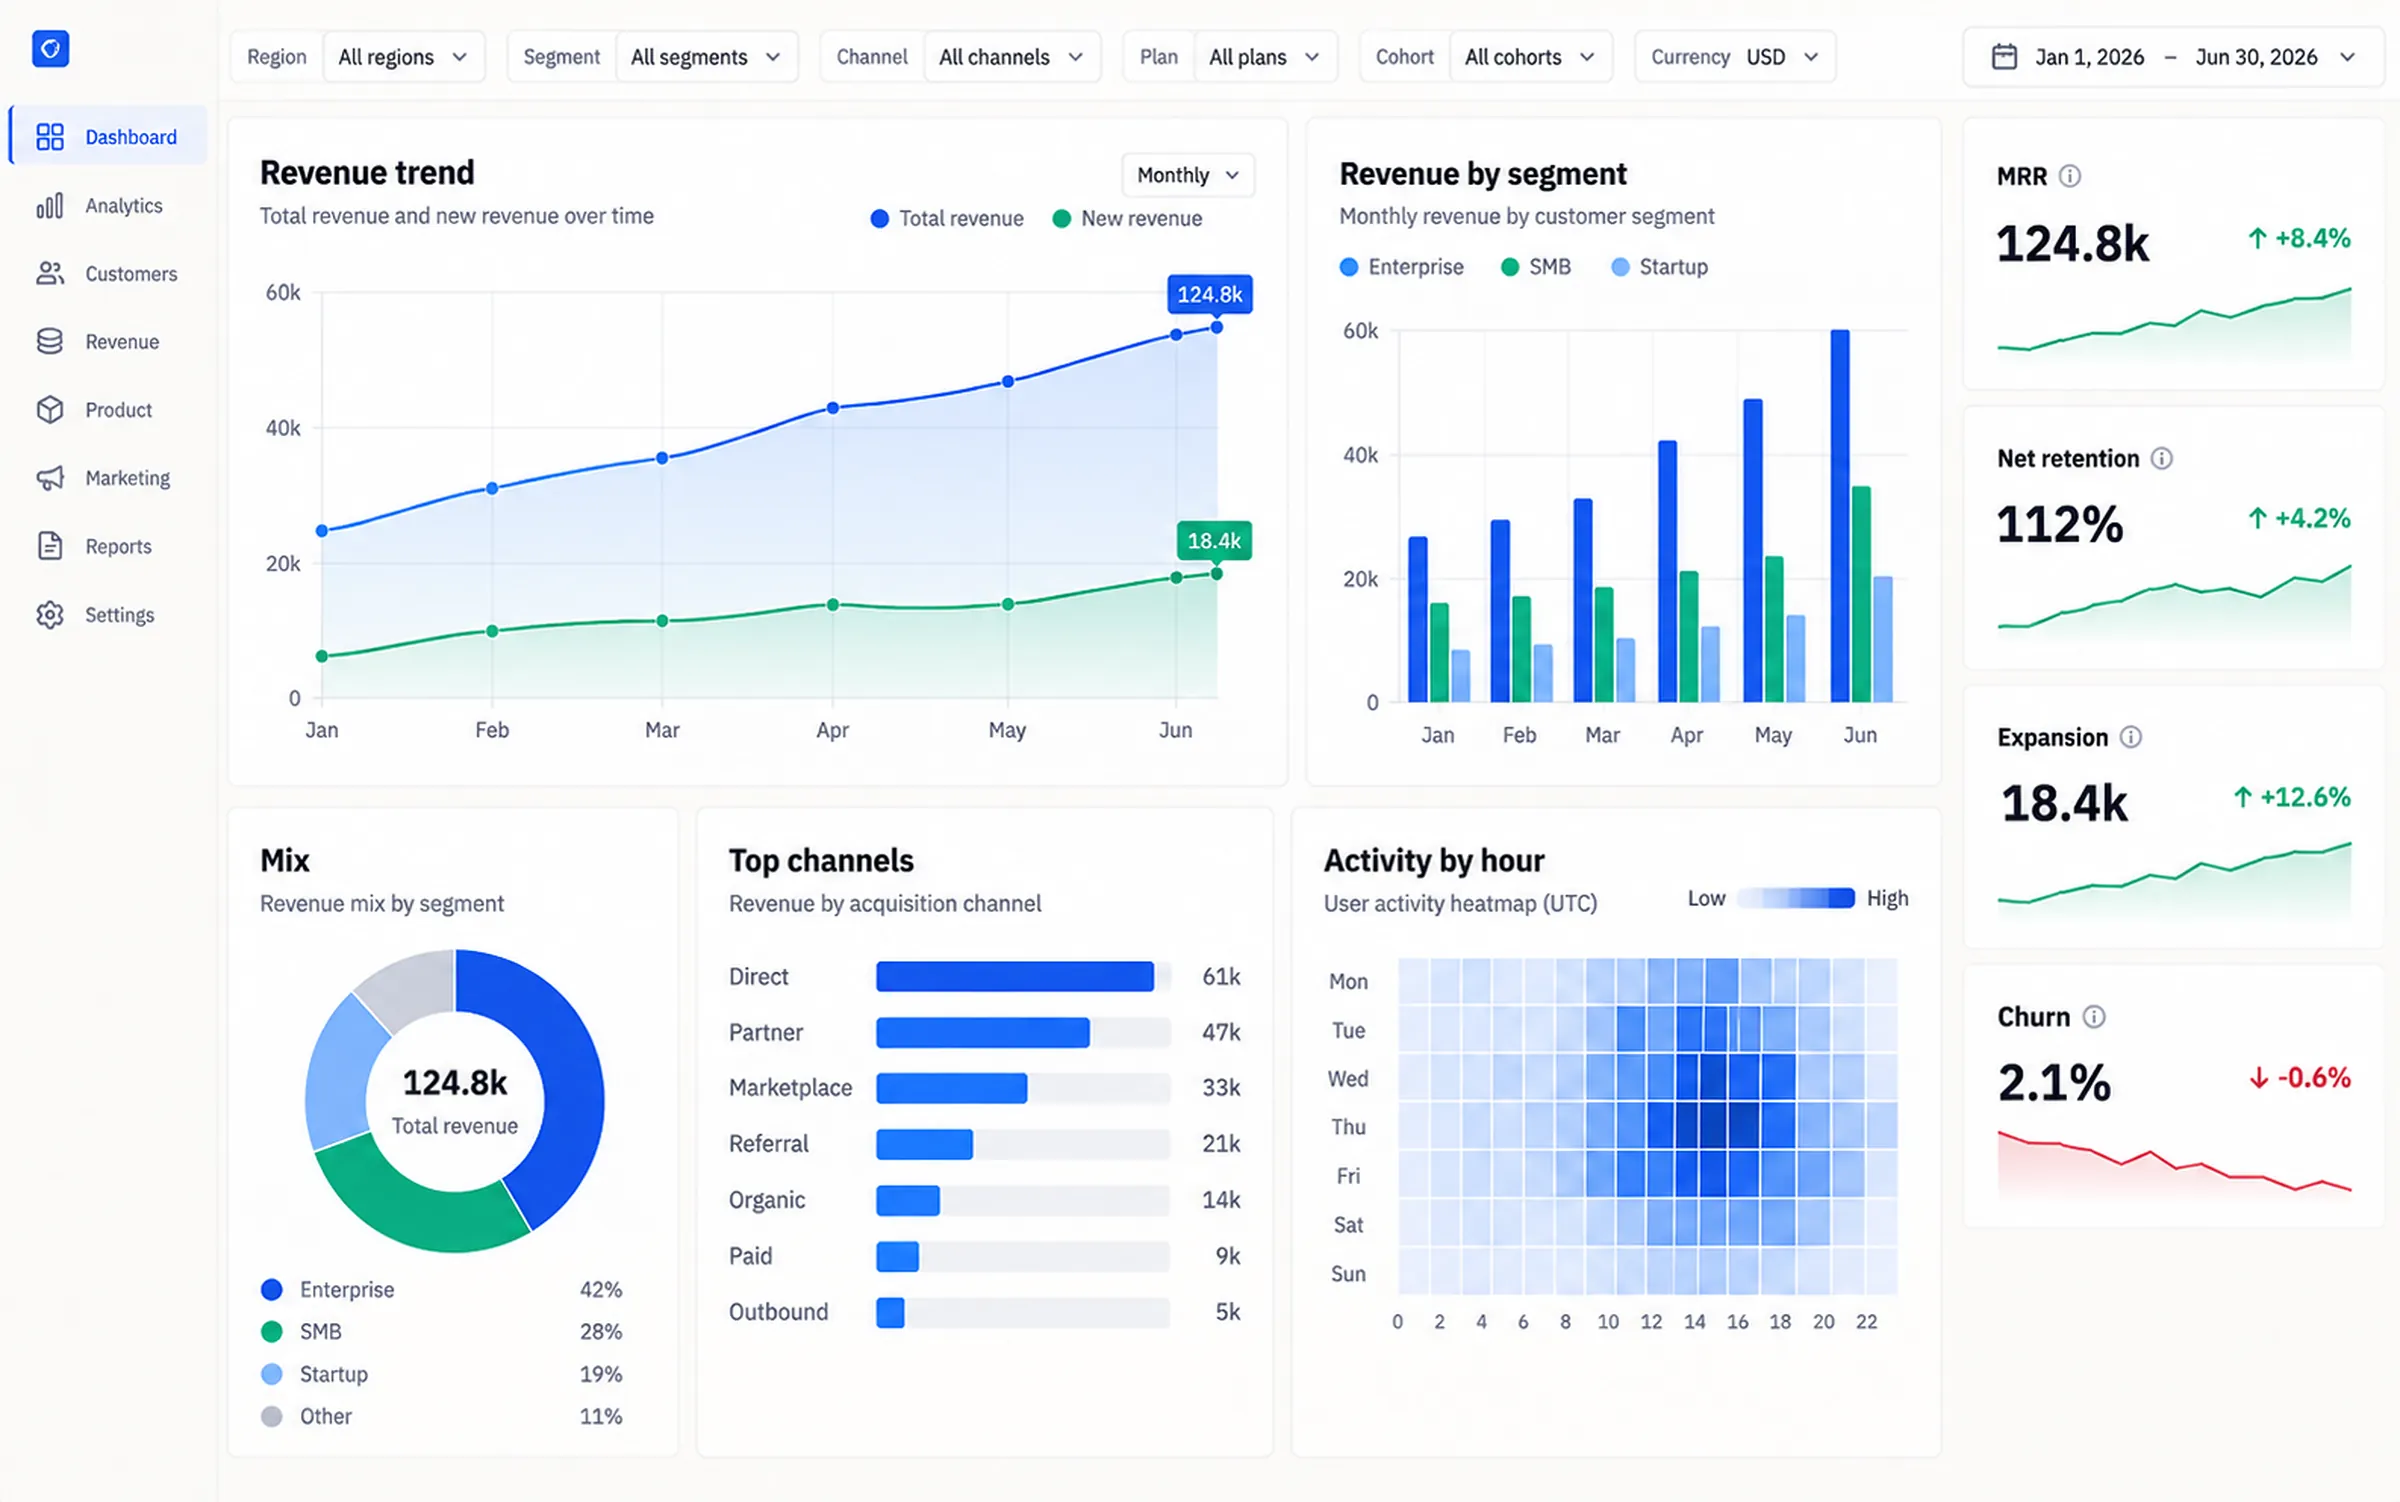
What the product is built around.
SIGNAL puts a governed semantic layer between the question and the warehouse. Metrics are defined once, so the model composes from validated definitions rather than guessing at table joins. Answers arrive with the query that produced them, the segments that drove the change, and a path to investigate further.
Semantic layer, not text-to-SQL
The model selects from defined metrics and dimensions. It cannot invent a join, because it never writes raw SQL against raw tables.
Answers explain the change
A movement is decomposed by contributing segment with the effect quantified, so the answer is a diagnosis rather than a restatement.
Every answer is reproducible
The generated query, the inputs and the semantic version are attached. Re-running an answer months later produces the same number or tells you why it cannot.
What makes this hard.
Every company has dashboards and still cannot answer 'why did revenue decline last week'. The dashboard shows that it declined. Finding out why means an analyst, a few days, and a definition argument about what revenue means. Text-to-SQL tools make this worse by generating plausible queries against the wrong tables.
- 01
Dashboards answer 'what' and never 'why'
- 02
Every team has a different definition of the same metric
- 03
Generated SQL is syntactically valid and semantically wrong
- 04
Anomaly alerts fire constantly and explain nothing
- 05
The analysis that mattered lives in someone's notebook, unreproducible
What the system does.
SIGNAL puts a governed semantic layer between the question and the warehouse. The model selects from validated metric and dimension definitions instead of writing SQL against raw tables, so it cannot invent a join. Answers decompose a movement by contributing segment, and the compiled query, inputs and semantic version travel with the answer so it can be reproduced.
The model composes from certified metrics, never authors raw SQL
Ambiguous questions are refused with options instead of answered arbitrarily
Movements decomposed by segment with the effect quantified
Row-level access injected into the compiled query, not filtered from results
Cost guards reject a query projected to scan beyond budget
SIGNAL, as working interface.
Rendered UI, not a mockup — real tables, charts, filters and states. Try ⌘K for the command palette.
Revenue (7D)
$1.84M
New customers
1,284
Net revenue retention
108.4%
Open anomalies
4
Answer — contribution analysis
Why did revenue decline last week?
Retrieval trace
Resolved metric · revenue (semantic v42, owner: Finance)
Period · 2026-09-14 → 2026-09-20 vs prior 7 days
Decomposed across 6 dimensions · 214 segment combinations
Row-level permissions applied · EMEA-restricted rows excluded
Revenue fell 6.2% to $1.84M week over week, a decline of $121K 1. The movement is concentrated, not broad: 84% of the drop comes from one segment 2.
Self-serve annual plans in North America fell 31.4%, contributing −$101K. New-customer volume in that segment was flat, so the driver is conversion to annual rather than demand 2.
The proximate cause is a pricing-page experiment that started on 14 September and removed the annual discount badge. Annual plan selection in the exposed variant dropped from 34% to 12% 3.
Enterprise and EMEA self-serve were both slightly positive, which is why the aggregate decline understates the segment effect 2.
Sources
- [1]metric: revenue · semantic layer v42owner Finance
- [2]Contribution analysis · 6 dimensions214 segments
- [3]experiment: pricing_page_annual_badgestarted Sep 14
Contribution to change
$KRevenue — actual vs forecast
90D · dailyGenerated query — semantic layer, not raw SQL
reproducible-- semantic v42 · compiled, not authored by the modelSELECT d.segment, d.plan_term, d.region, {{ metric.revenue }} AS revenue, {{ metric.revenue.prior_period }} AS revenue_prior, {{ metric.revenue.contribution }} AS contributionFROM {{ model.subscription_facts }} fJOIN {{ dim.customer }} d USING (customer_key)WHERE f.date BETWEEN '2026-09-14' AND '2026-09-20' AND {{ policy.row_level_access }} -- applied, not optionalGROUP BY 1, 2, 3ORDER BY contribution ASC;Segment detail
| Segment | Region | Term | Revenue | W/W | Contribution | Trend | Signal |
|---|---|---|---|---|---|---|---|
| Self-serveAnnual | North America | Annual | $220,400 | −31.4% | −$101.0K | Experiment | |
| Self-serveMonthly | North America | Monthly | $412,800 | −5.1% | −$22.2K | Related | |
| EnterpriseAnnual | North America | Annual | $684,200 | +2.1% | +$14.1K | Normal | |
| Self-serveAll terms | EMEA | Mixed | $318,600 | +2.9% | +$9.0K | Not exposed | |
| EnterpriseAnnual | EMEA | Annual | $164,200 | +2.5% | +$4.0K | Normal | |
| Other / partnerMixed | Global | Mixed | $42,200 | −12.4% | −$6.0K | Low volume |
Contribution sums to the −$121K aggregate change · row-level permissions applied to the asker
Anomaly feed
- Annual plan conversion34% → 12% · explained by pricing experimentexplained
- Revenue below forecast interval4 consecutive days outside 95% bandexplained
- Support ticket volume spike+41% · correlated with pricing page changecorrelated
- APAC activation drop−8.2% · no driver identified yetopen
- Trial-to-paid stableWithin seasonal band · no actioncleared
Metric governance
- Metric
- revenue
- Semantic version
- v42
- Owner
- Finance
- Definition
- Recognised, net of refunds
- Grain
- day × customer × plan
- Certified
- Yes · reviewed Sep 01
- Upstream models
- 4
- Downstream uses
- 31 dashboards · 6 reports
Answer quality
eval suite- Metric resolution accuracy97.1%
- Query correctness94.2%
- Contribution accuracy92.4%
- Refusal on ambiguity89.1%
- Permission leakage0 / 2,800
Investigation path
- Recommendation draftedStep 5
Suggest reverting the badge variant · projected recovery $98K/week
- Experiment correlatedStep 4
pricing_page_annual_badge start date aligns to the inflection within 1 day
- Driver isolatedStep 3
New-customer volume flat · conversion-to-annual is the moving variable
- Segment localisedStep 2
84% of the decline in self-serve annual, North America
- Change detectedStep 1
Revenue −6.2% w/w · outside the 95% forecast interval
Conversion to annual by week / region
Interface states
UI statesNo metrics defined
Define your first metric in the semantic layer so questions resolve against governed definitions.
Define metricEmpty stateQuestion is ambiguous
‘Revenue’ maps to three certified metrics (recognised, billed, bookings). Pick one rather than getting an arbitrary answer.
How it is put together.
The semantic layer is the guardrail. The model composes from definitions; it never writes SQL against physical tables.
- 01
Conversational UI
Question entry, answer rendering, drill-down and dashboard composition.
- Next.js
- React
- Streaming
- 02
Question Planner
Intent resolution, metric and dimension selection, ambiguity detection.
- LLM
- Structured output
- Metric catalogue
- 03
Semantic Layer
Versioned metric definitions, grain, joins, ownership and certification state.
- Semantic models
- Version control
- Lineage
- 04
Query Compiler
Compiles a semantic request to warehouse SQL with row-level policy injected.
- SQL generation
- Policy engine
- Cost guard
- 05
Analysis Engine
Contribution decomposition, seasonality-aware detection and forecasting.
- Python
- Statistical models
- Time series
- 06
Warehouse
Governed models over source systems with tested transformations.
- Warehouse
- dbt-style models
- Tests
What the product does.
The capability set the demonstration is built around.
Natural-language analytics
Conversational questions resolved against a governed metric catalogue.
Semantic layer
Versioned metric and dimension definitions with ownership and lineage.
Dashboards
Composable boards built from the same definitions the assistant uses.
Anomaly detection
Seasonality-aware detection with contribution analysis attached to each alert.
Forecasting
Baseline forecasts with prediction intervals and driver decomposition.
Automated reports
Scheduled narrative summaries highlighting what changed and why.
Data exploration
Drill-down from any answer into the underlying rows with permissions applied.
Challenges, and the MaatX approach.
The problems that actually decide whether a system like this survives production — and how we address each one.
Generated SQL is confidently wrong against raw tables
The model never authors SQL. It selects metrics and dimensions from a validated catalogue, and a compiler produces the query. An unresolvable question is refused instead of approximated.
'Revenue' means four different things depending on who asks
Metrics are defined once with an owner and a certification state. When a question maps to multiple certified metrics the system asks which one rather than picking.
Anomaly alerts without explanation are noise
Detection is seasonality-aware and every alert runs contribution analysis before it is delivered, so the alert arrives with the segment that caused it already identified.
A natural-language query can accidentally scan the whole warehouse
The compiler enforces cost guards, grain limits and time bounds. A query projected to exceed budget is rejected with the reason rather than run and billed.
Row-level permissions must survive the AI layer
Access policy is injected into the compiled query, not filtered from results. The engine cannot return a row the asker is not entitled to read.
An answer from three months ago cannot be reproduced
Answers store the compiled query, the semantic version and the inputs. Re-running either reproduces the number or reports which definition changed.
The stack behind it.
Question planning
- LLMs
- Structured output schemas
- Metric catalogue retrieval
- Embeddings
- Ambiguity detection
- Refusal policy
Semantic layer
- Semantic models
- Versioned metric definitions
- Dimension and grain modelling
- Join path resolution
- Certification state
- Lineage graph
- Version-controlled definitions
Query compilation
- SQL generation
- Query plan validation
- Row-level policy injection
- Cost guard
- Scan estimation
- Grain and time bounds
- Warehouse dialect adapters
Analysis engine
- Python
- Contribution analysis
- Time-series forecasting
- Seasonal decomposition
- Change-point detection
- Prediction intervals
- Significance testing
Warehouse & modelling
- Columnar warehouse
- dbt-style models
- Incremental materialisation
- Model tests
- Partition pruning
- Semantic-versioned result cache
Answer surface
- Next.js
- React
- TypeScript
- Tailwind CSS
- Streaming responses
- SVG charts
Governance & reproducibility
- Policy engine
- Metric ownership
- Compiled-query provenance
- Answer replay
- Audit logging
- Evaluation suite
How it grows with the business.
The same system at three stages. Most products should not start at the third — but the architecture should not have to be thrown away to get there.
A handful of certified metrics answering questions for one team.
- Core metric definitions in a semantic layer
- Natural-language question answering
- Generated query shown with every answer
- Basic dashboards
Company-wide metrics with anomaly detection that explains itself.
- Full metric catalogue with ownership and certification
- Seasonality-aware anomaly detection
- Contribution analysis attached to every alert
- Forecasts with prediction intervals
Governed analytics with lineage and cost control.
- Row-level policy enforcement and audit
- Metric lineage from answer to source table
- Scheduled narrative briefings by team
- Materialisation recommendations for query cost
Where it could go next.
Directions this system would extend into.
- 01
Causal inference beyond correlation for driver attribution
- 02
Self-serve metric proposals reviewed by the owning team
- 03
Narrative briefings pushed to the teams a change actually affects
- 04
What-if modelling over the semantic layer
- 05
Query cost optimisation through materialisation recommendations

Needing analytics your team trusts enough to argue with?
We built SIGNAL to work through exactly this. Tell us where you are and we will tell you what we would do differently for your constraints.