PULSE
AI Operations Platform
Detect operational problems before they become expensive.
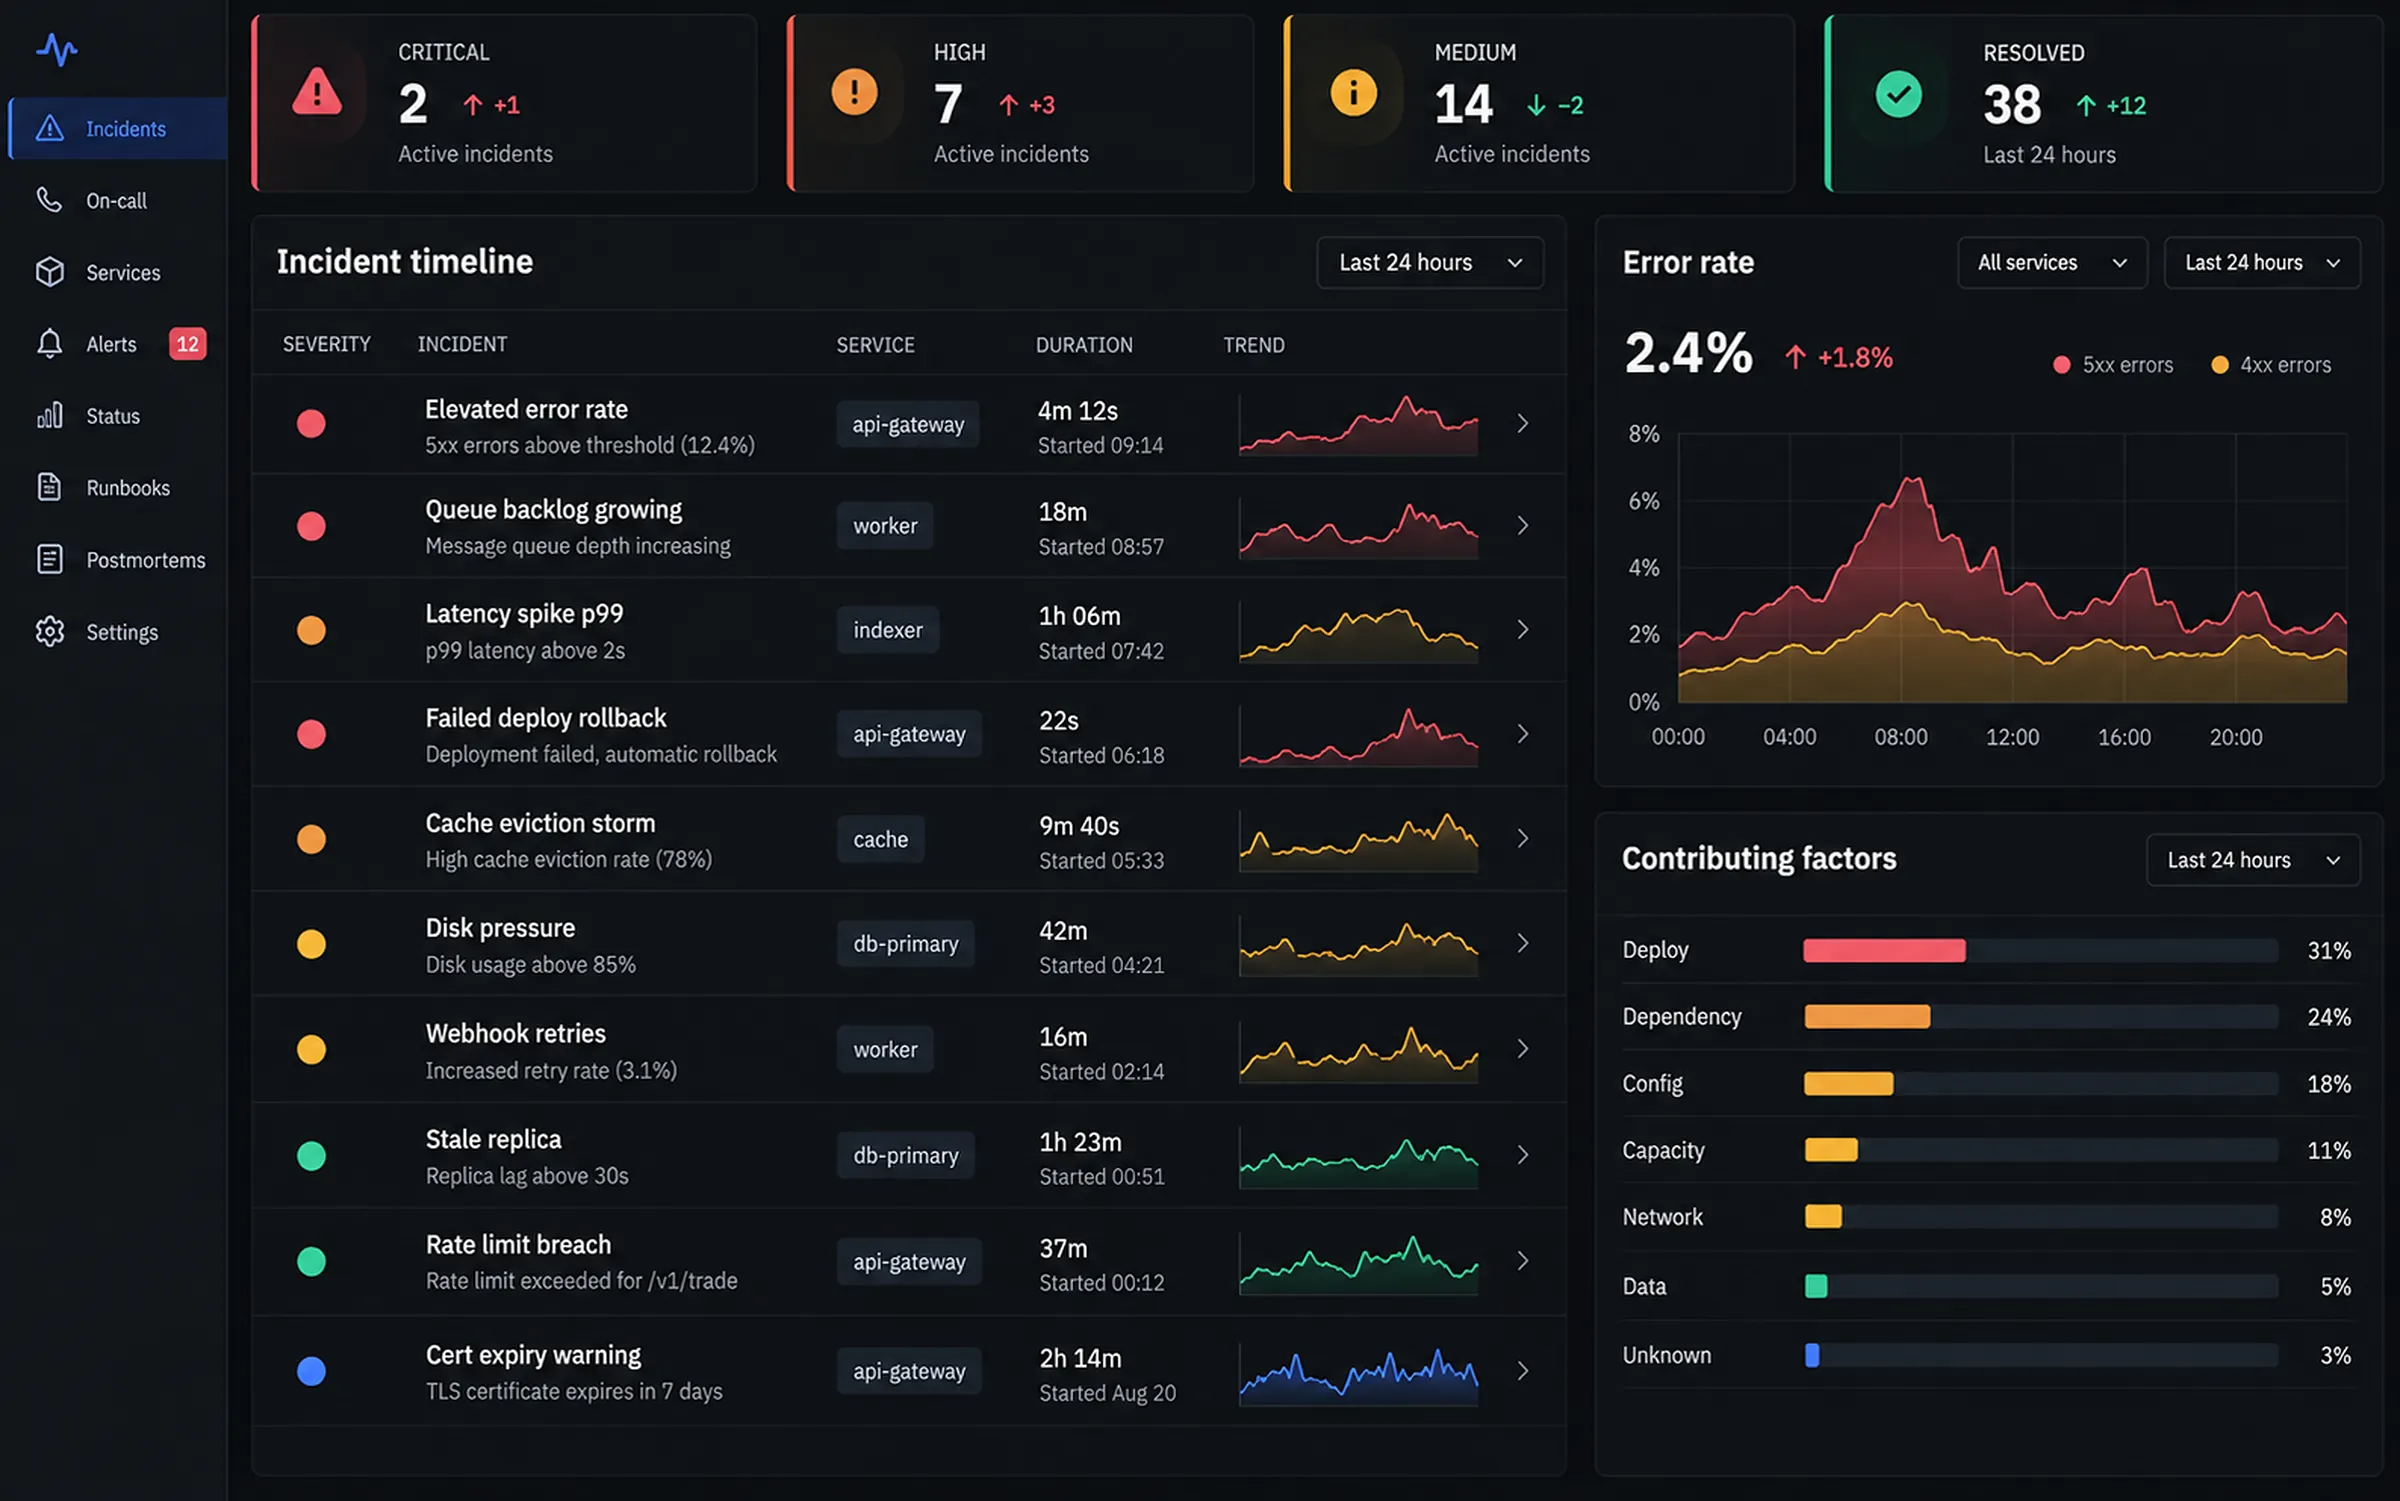
Turn forty simultaneous alerts into one incident with a probable cause and a tested way to fix it.
- Signal correlation
- Learned baselines
- Root-cause analysis
- Gated runbooks
- Topology graph
Signal correlation, incident intelligence and AI root-cause analysis that turns forty simultaneous alerts into one incident with a probable cause.
What the product is built around.
PULSE correlates signals into incidents using the service dependency graph, then reasons over the correlated evidence to propose a cause with the observations that support it. Remediation is executable, gated, and recorded — so responding is a decision rather than an investigation.
Incidents, not alerts
Signals are grouped by topology and time into a single incident with one owner, so the on-call engineer reads one page instead of forty.
Causes with evidence
Root-cause analysis cites the specific deploy, metric shift and log pattern it reasoned from. A hypothesis without evidence is not presented.
Runbooks that execute
Remediation is codified as gated automation with a dry-run and a rollback, not a wiki page someone follows under pressure.
What makes this hard.
When something breaks, everything alerts. Forty pages fire for one root cause, the on-call engineer spends the first twenty minutes working out which service actually failed, and the post-mortem concludes that monitoring needs tuning. It never gets tuned, because the thresholds were never the problem.
- 01
One failure produces dozens of alerts across every dependent service
- 02
Static thresholds are either too noisy to read or too loose to catch anything
- 03
Correlating logs, metrics and traces at 3am is manual archaeology
- 04
The same incident recurs and nobody connects it to the last one
- 05
Remediation runbooks exist as documents rather than executable steps
What the system does.
PULSE correlates signals by service topology and time into a single incident before anything pages a human, then reasons over the correlated evidence to propose a cause citing the deploy, metric shift and log pattern it used. Remediation is executable, dry-run first and gated on approval, with recovery verified against a metric inside a time bound.
One incident with one owner instead of forty pages for one root cause
Learned per-signal baselines with seasonality, so thresholds never need tuning
Root-cause hypotheses ranked by confidence with the evidence cited
Similar-incident matching against history, with the resolution that worked
Runbooks that dry-run, gate on approval and verify recovery or escalate
PULSE, as working interface.
Rendered UI, not a mockup — real tables, charts, filters and states. Try ⌘K for the command palette.
Open incidents
3
Signals correlated
412 → 3
Median MTTR
11m 24s
Auto-remediated
68%
INC-4182 — checkout latency degradation
- Severity
- SEV-2
- Status
- Mitigating
- Opened
- 14:02:18 UTC
- Duration
- 8m 41s
- Signals correlated
- 184 → 1
- Services affected
- 6 of 84
- Customer impact
- ~4.2% of checkouts
- Commander
- On-call Engineer
AI root-cause analysis
What caused the checkout latency spike and what should I do about it?
Retrieval trace
Correlated 184 signals across 6 services into 1 incident
Compared against 2,840 historical incidents · 1 strong match
Examined 4 deploys and 2 config changes in the 30m window
Ruled out load — request volume within the normal band
Checkout p99 latency rose from 240ms to 4.1s starting 14:01:40 1. Request volume was flat, so this is not a load event 2.
The most likely cause is the payment-service deploy at 14:01:12, which introduced a database query without an index on the new `settlement_ref` column. Query time on that statement went from 2ms to 3.8s and accounts for 92% of the added latency 3.
Connection-pool saturation on payment-service is a downstream effect, not the cause — the pool filled because queries stopped returning, and the five dependent service alerts follow from that 1.
This matches INC-3914 from 11 August, where the same pattern was resolved by rolling back the deploy and shipping the index separately 4.
Recommended action: roll back payment-service to the previous revision. The rollback runbook is available with a dry-run, and estimated recovery is under two minutes.
Sources
- [1]Signal correlation · 184 signals, 6 services14:01:40
- [2]metric: checkout.requests.rateflat ±2%
- [3]trace: payment-service · slow query2ms → 3.8s
- [4]INC-3914 · resolved by rollbackAug 11
Checkout p99 latency
60m · msBlast radius — service dependency graph
propagation- Root cause
- Degraded
- Healthy
Incident timeline
- Rollback proposed14:10:59
Runbook rb-payment-rollback · dry-run passed · awaiting commander approval
- Root cause identified14:04:22
Unindexed query on settlement_ref · confidence 0.91 · 4 evidence sources
- Similar incident matched14:02:41
INC-3914 · 0.88 similarity · resolved by rollback in 3m
- Incident declared SEV-214:02:18
184 signals correlated into one incident · on-call paged once
- Connection pool saturated14:01:52
payment-service pool 100% · downstream effect, not cause
- Anomaly detected14:01:40
checkout p99 exceeded learned baseline by 14σ
- Deploy — payment-service14:01:12
Revision 4f82c1 · 1 migration · 3 files changed
Remediation runbook
rb-payment-rollback- Incident SEV-2 declaredTrigger
Auto-armed on root-cause confidence > 0.85
- Dry-run validationAction
Verify previous revision is healthy and reachable
- Impact assessmentAI
Check for in-flight writes and pending migrations
- Commander approvalHuman
SEV-2 rollback requires explicit approval
ApproveHoldReject - Execute rollbackAction
Shift traffic to previous revision · drain gracefully
- Verify recoveryDecision
p99 must return below 400ms within 3m or auto-escalate
- Resolve & recordOutput
Post-mortem draft generated
Correlated signals
| Signal | Service | Type | Baseline | Observed | Deviation | Role | First seen |
|---|---|---|---|---|---|---|---|
| db.query.duration.p99 | payment-service | Metric | 2ms | 3,800ms | 1900× | Causal | 14:01:38 |
| deploy.revision.changed | payment-service | Event | — | 4f82c1 | — | Trigger | 14:01:12 |
| checkout.latency.p99 | checkout | Metric | 240ms | 4,140ms | 17× | Symptom | 14:01:40 |
| db.pool.utilisation | payment-service | Metric | 38% | 100% | 2.6× | Downstream | 14:01:52 |
| http.5xx.rate | orders | Metric | 0.02% | 3.80% | 190× | Downstream | 14:02:04 |
| log.pattern.timeout | cart | Log | 4/min | 1,840/min | 460× | Downstream | 14:02:11 |
| queue.depth | notify | Metric | 120 | 184 | 1.5× | Suppressed | 14:02:30 |
7 of 184 correlated signals · role is assigned by the correlation engine, not by alert severity
Signal sources
- Metrics52.2%
- Logs26.1%
- Traces15.2%
- Deploy events4.3%
- Config changes2.2%
Hypothesis ranking
confidence- Unindexed query (deploy 4f82c1)0.91
- Connection pool misconfiguration0.34
- Upstream provider latency0.12
- Traffic surge0.04
- Infrastructure failure0.02
Recurrence intelligence
- INC-3914 · Aug 11Same pattern · resolved by rollback in 3m0.88
- INC-3612 · Jun 28Missing index on new column · 22m MTTR0.74
- INC-2844 · Apr 02Pool saturation, different cause0.51
- Pattern flagged3rd migration-without-index incident this yearaction
- Prevention suggestedAdd a CI check for unindexed query pathsopen
Interface states
UI statesNo open incidents
All services are within their learned baselines. Signal ingestion is active.
View signal healthEmpty stateCorrelation engine degraded
Trace ingestion is behind by 40s. Incidents are still created from metrics and logs, but root-cause confidence is reduced.
How it is put together.
Correlation happens before notification. Nothing pages a human until the signals have been grouped into an incident.
- 01
Operations Console
Incident view, AI analysis, signal timeline and remediation controls.
- Next.js
- React
- Streaming
- 02
Detection
Per-signal learned baselines with seasonality and deploy-window awareness.
- Python
- Time series
- Change-point detection
- 03
Correlation Engine
Topology-aware grouping of signals into incidents with causal role assignment.
- Rust
- Dependency graph
- Time windows
- 04
Analysis
Evidence gathering, hypothesis ranking and historical incident matching.
- LLM
- Retrieval
- Embeddings
- 05
Automation
Gated runbook execution with dry-run, approval and verified rollback.
- Workflow engine
- RBAC
- Idempotent steps
- 06
Telemetry
Metrics, logs, traces and deploy events ingested on a common timeline.
- OpenTelemetry
- ClickHouse
- Kafka
What the product does.
The capability set the demonstration is built around.
Anomaly detection
Per-signal baselines learned from history with seasonality and deploy awareness.
Alert correlation
Topology and time-window grouping that collapses alert storms into one incident.
Incident intelligence
Similar-incident matching against history with the resolution that worked.
Root-cause analysis
Evidence-cited hypotheses ranked by confidence across deploys, config and load.
System signals
Unified metrics, logs, traces and deploy events on one timeline.
Automated workflows
Gated remediation with dry-run, approval and automatic rollback.
Challenges, and the MaatX approach.
The problems that actually decide whether a system like this survives production — and how we address each one.
One failure produces forty pages and the on-call reads none of them
Signals are correlated by service topology and time window into a single incident before anything notifies. The dependency graph decides which signals are causes and which are consequences.
Static thresholds are wrong in both directions
Baselines are learned per signal with seasonality and deploy awareness. Detection reports deviation in sigma against the learned band, so a threshold never needs hand-tuning.
An AI root cause that cannot be checked is worse than no root cause
Hypotheses are ranked with confidence and every claim cites the signal, trace or deploy event it came from. Low-confidence hypotheses are shown as alternatives, not presented as the answer.
Automated remediation can turn a degradation into an outage
Runbooks dry-run first, gate on approval above a severity threshold, and verify recovery against a metric within a time bound — auto-escalating rather than retrying if verification fails.
The same class of incident keeps happening
Incidents are embedded and matched against history. Repeated patterns surface as a prevention recommendation attached to the class, not just a resolution for the instance.
Ingesting billions of signals per day is not affordable at full fidelity
Raw telemetry is downsampled into baselines with full fidelity retained only around anomalies, which keeps the detail where investigation needs it and the cost bounded.
The stack behind it.
Telemetry ingestion
- OpenTelemetry
- Kafka
- ClickHouse
- Prometheus remote write
- Tail-based trace sampling
- Log pattern mining
- Downsampled rollups
Detection
- Python
- Learned per-signal baselines
- Seasonal time-series decomposition
- Change-point detection
- Sigma deviation scoring
- Deploy-window suppression
Correlation engine
- Rust
- Service dependency graph
- Topology-aware grouping
- Sliding time windows
- Graph algorithms
- Causal role assignment
- Signal suppression rules
Incident reasoning
- LLMs
- Embeddings
- Hybrid retrieval
- Hypothesis ranking
- Evidence citation binding
- Similar-incident matching
Remediation automation
- Workflow engine
- Idempotent steps
- Dry-run execution
- Approval gates
- RBAC
- Verified rollback
- Time-bounded recovery checks
Response surface
- Next.js
- React
- TypeScript
- Streaming updates
- SVG topology rendering
- Virtualised signal timeline
State & platform
- PostgreSQL
- Redis
- Kubernetes
- Terraform
- On-call paging integrations
- Structured audit logs
How it grows with the business.
The same system at three stages. Most products should not start at the third — but the architecture should not have to be thrown away to get there.
Anomaly detection and correlation on the services that page most.
- Metric ingestion with learned baselines
- Time-window correlation into incidents
- Incident view with the signal timeline
- Paging integration
Topology-aware correlation with AI root-cause analysis.
- Service dependency graph for causal roles
- Logs, traces and deploy events on one timeline
- Evidence-cited root-cause hypotheses
- Historical incident matching
Automated remediation and prevention across the estate.
- Gated runbook automation with verified rollback
- Predictive detection before user impact
- Change-risk scoring that gates deploys
- Automatic post-mortem drafting
Where it could go next.
Directions this system would extend into.
- 01
Predictive detection that flags degradation before user impact
- 02
Automatic post-mortem drafting from the incident record
- 03
Change-risk scoring that gates deploys on predicted incident probability
- 04
Cost-aware remediation that accounts for the price of each action
- 05
Dependency graph learned from traces rather than declared

Drowning in alerts that do not tell you which one is the cause?
We built PULSE to work through exactly this. Tell us where you are and we will tell you what we would do differently for your constraints.