ATLAS CONTROL
Developer Infrastructure Platform
One control plane for modern application infrastructure.
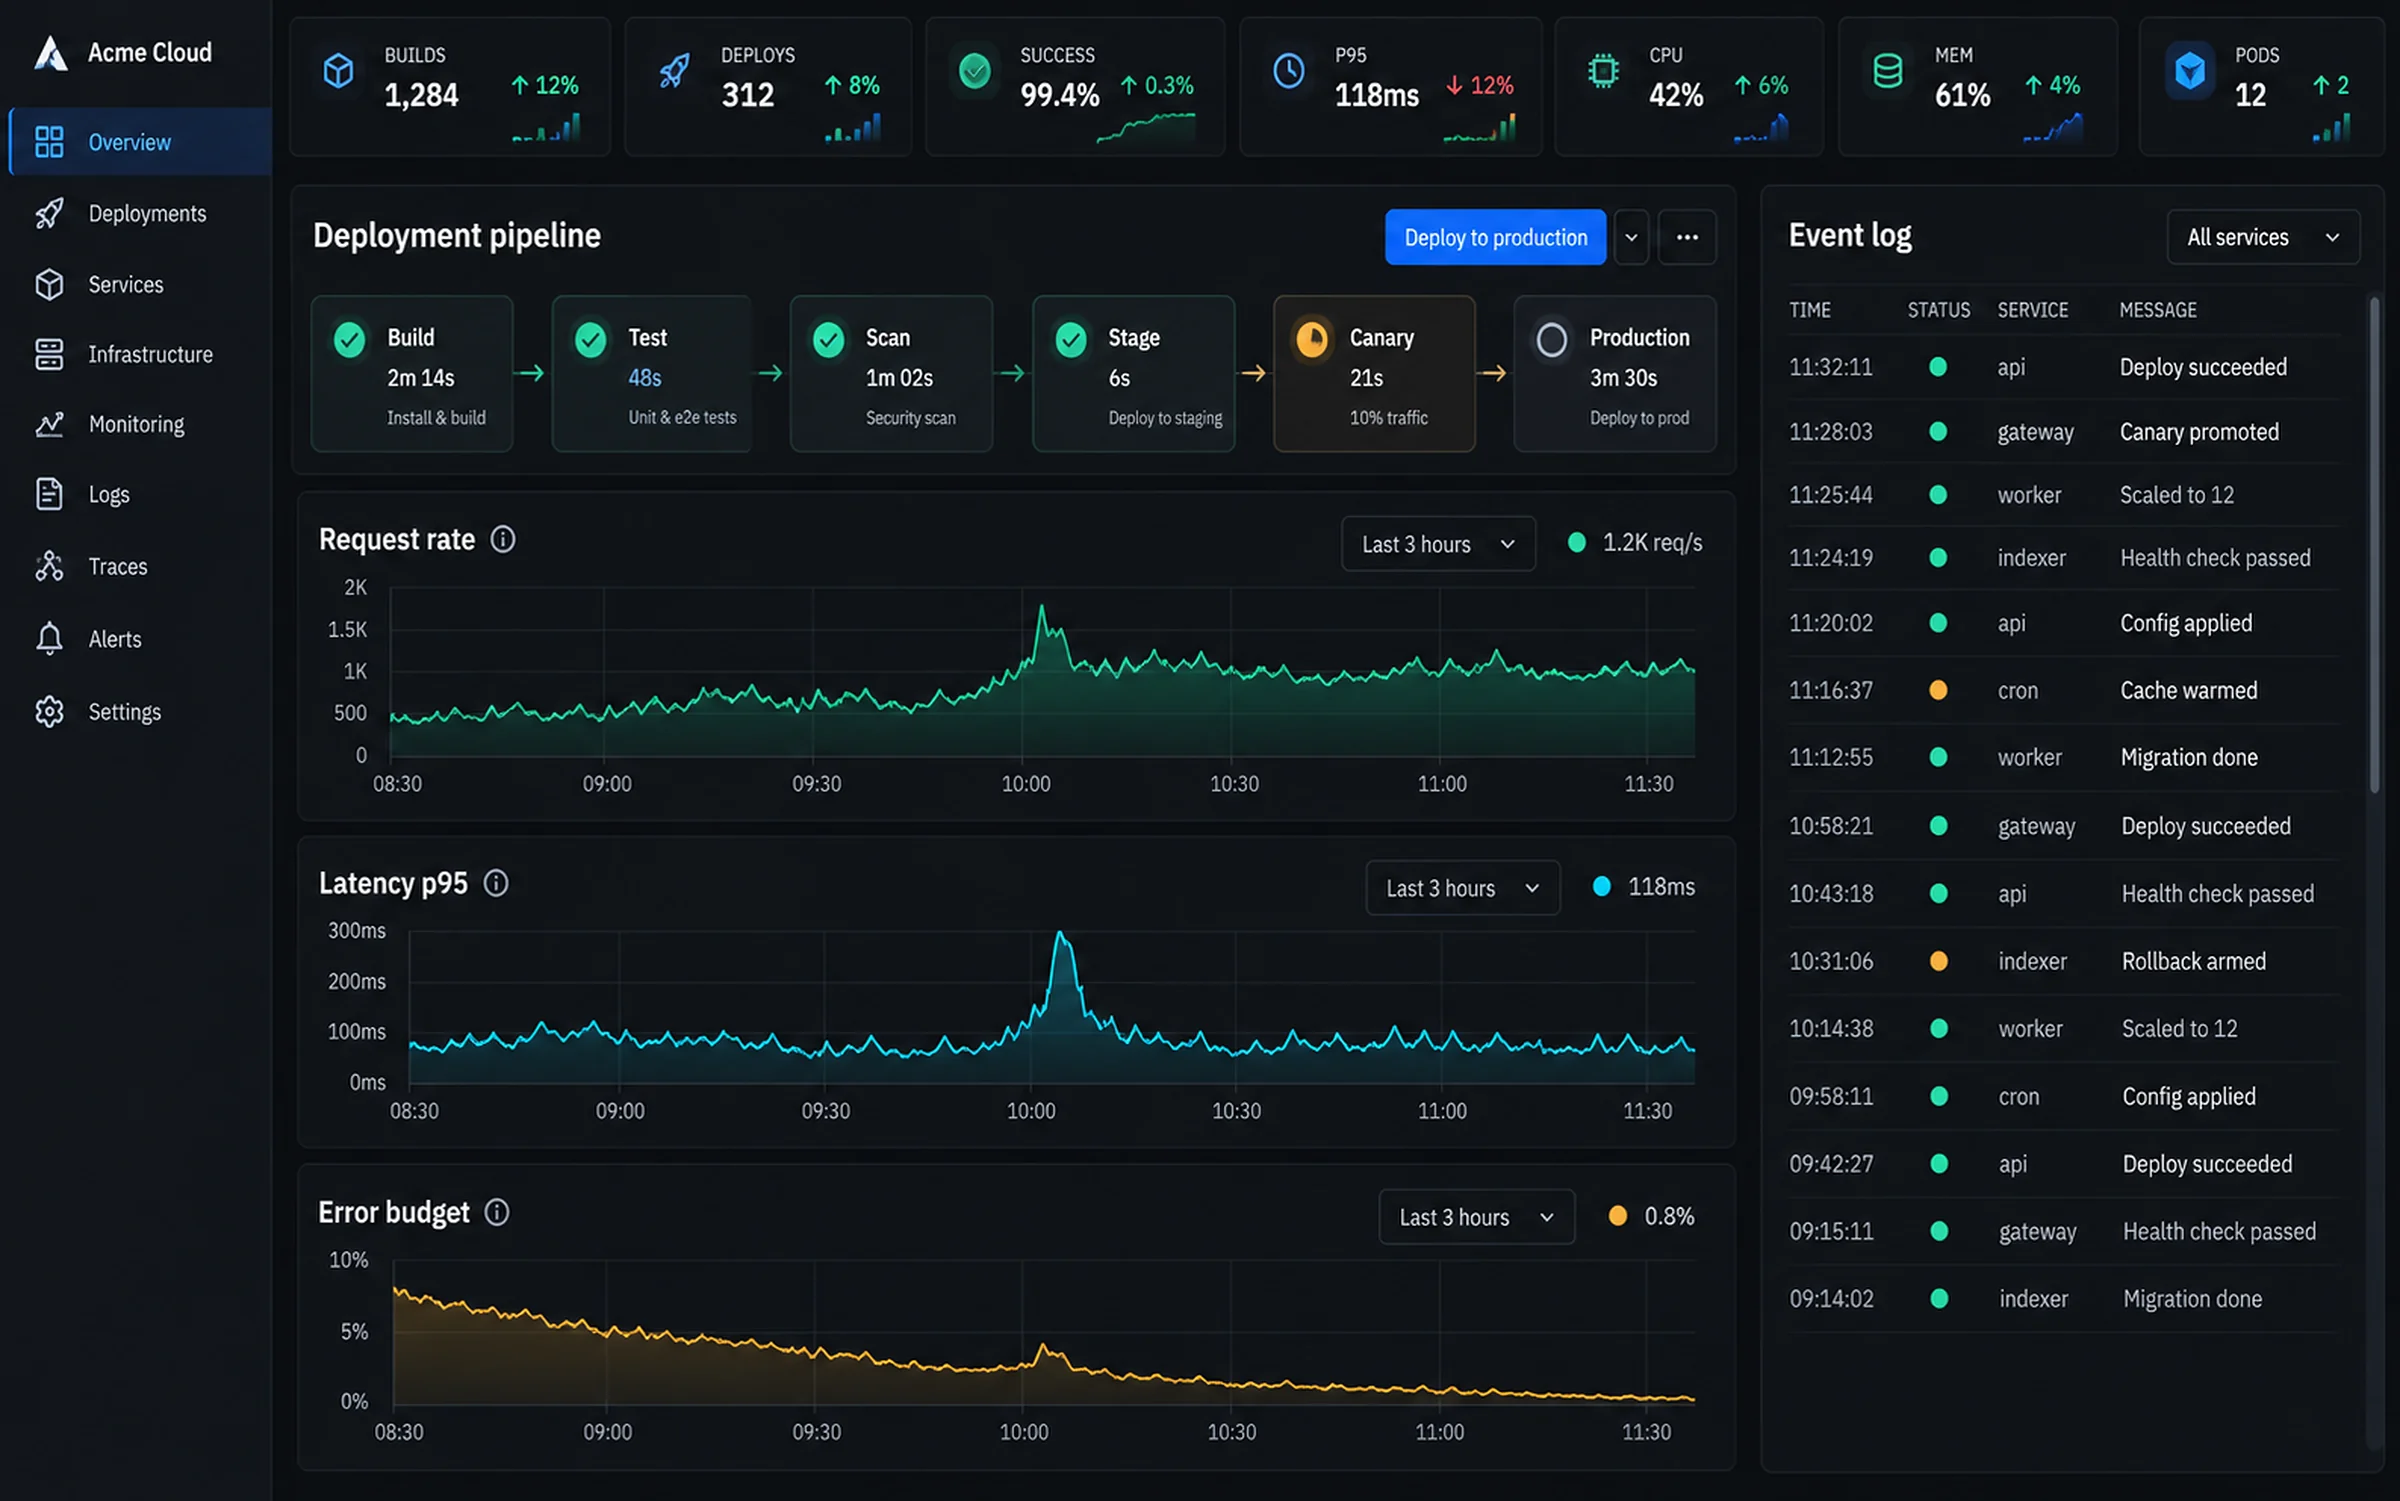
Ship many times a day and always be able to answer what is running, what changed, and how to get back.
- Declarative reconciliation
- Canary analysis
- Health gates
- Auto rollback
- Drift detection
Services, environments, deployments, logs and infrastructure health in a single control plane — with progressive delivery and automatic rollback built in.
What the product is built around.
ATLAS CONTROL makes the service the unit of management. A service declares what it needs, the platform reconciles it per environment, and every deploy is a progressive rollout with health gates and an automatic path back. What is running and why is always answerable.
Declared, then reconciled
Desired state is declarative and continuously reconciled. Drift is detected and reported rather than discovered during an incident.
Rollback is the default path
Every deploy is progressive with health gates. Failing a gate rolls back automatically — reverting is not a heroic manual act.
One timeline
Deploys, config changes, logs and metrics share a single timeline, so correlating a regression to a change takes one screen.
What makes this hard.
Infrastructure knowledge ends up distributed across a CI tool, a cloud console, a dashboard nobody owns and three people who remember how staging works. Shipping is fine until something goes wrong, at which point nobody can answer what changed, where it is running, or how to get back.
- 01
No single place shows what version of a service is live in which environment
- 02
Rollback is a manual scramble through CI history
- 03
Environment configuration drifts and nobody notices until a deploy fails
- 04
Logs, metrics and deploy events live in three tools with three timelines
- 05
Progressive rollout is aspirational rather than automated
What the system does.
ATLAS CONTROL makes the service the unit of management. A service declares what it needs, a reconciler converges infrastructure toward that state continuously and reports drift, and every deploy is a progressive rollout with health gates and a pre-validated path back. Deploys, config changes, logs and metrics share one timeline, so correlating a regression to a change is a single query.
Declared state continuously reconciled, with drift reported rather than discovered
Progressive rollouts with per-stage gates and a minimum observation window
Rollback pre-computed and pre-validated, so it is the boring path not the emergency one
Deploys, config, logs and metrics on one timeline keyed by service and revision
One API behind both UI and CLI, with the same RBAC and audit log
ATLAS CONTROL, as working interface.
Rendered UI, not a mockup — real tables, charts, filters and states. Try ⌘K for the command palette.
Deploys (7D)
412
Change failure rate
2.1%
Median lead time
18m
Error budget
68%
payments-api · rollout rev 4f82c1
- Environment
- production
- Strategy
- Canary · 5/25/50/100
- Current stage
- 25% · 6m elapsed
- Replicas
- 6 new / 18 old
- Health gates
- 3 of 4 passing
- Error rate (canary)
- 0.04%
- p99 (canary)
- 218ms vs 224ms
- Auto-rollback
- Armed
Canary vs baseline — p99 latency
rollout window · msHealth gates
canary analysis- Error rate ≤ 0.10%0.04% · pass
- p99 within 10% of baseline−2.7% · pass
- No new log error patterns0 new · pass
- Saturation ≤ 70%78% · failing
- Minimum observation 5m6m · pass
Service catalogue
| Service | Owner | Prod revision | Replicas | SLO | Error budget | Drift | Status |
|---|---|---|---|---|---|---|---|
| payments-apiGo · 1.24 | Payments | 4f82c1 → rollout | 24 | 99.95% | 68% | None | Deploying |
| checkout-webNext.js · 16 | Commerce | a19d04 | 18 | 99.98% | 84% | None | Healthy |
| ledger-coreRust · 1.84 | Platform | 7c2e41 | 12 | 99.99% | 92% | None | Healthy |
| notify-workerPython · 3.13 | Platform | e84b19 | 8 | 99.90% | 41% | Config | Drifted |
| search-indexerGo · 1.24 | Discovery | b62f88 | 6 | 99.50% | 18% | None | SLO risk |
| reporting-batchPython · 3.13 | Data | 0d41ac | 2 | 99.00% | 96% | None | Healthy |
6 of 84 services · error budget is remaining allowance for the current 30-day window
Deployment timeline
- Stage 25% — gate failing+06:12
Saturation 78% exceeds 70% gate · rollout paused, not rolled back yet
- Stage 5% → 25%+05:04
All gates passed at 5% · traffic increased to 6 replicas
- Canary receiving traffic+02:18
5% of production traffic · baseline comparison started
- Health check passed+00:48
New replicas ready · readiness probe green on 2 of 2
- Image pulled+00:12
ghcr.io/payments-api:4f82c1 · 184MB · cached layers reused
- Deploy started00:00
Triggered by merge to main · approved by 1 reviewer
Service definition
declared stateservice: payments-apiowner: paymentsruntime: { language: go, version: "1.24" }resources: cpu: 1000m memory: 2Gi replicas: { min: 12, max: 40, target_cpu: 60 }dependencies: - ledger-core - payments-db - notify-workerslo: availability: 99.95% latency_p99: 400ms window: 30ddeploy: strategy: canary steps: [5, 25, 50, 100] gates: - error_rate: { max: 0.10%, window: 5m } - latency_p99: { max_delta: 10%, window: 5m } - saturation: { max: 70% } auto_rollback: trueLive logs — payments-api canary
- connection pool near capacitylevel=warn pool.used=39 pool.max=50 rev=4f82c114:08:41
- intent createdlevel=info intent=pi_8fK2 amount=4280.00 rev=4f82c114:08:41
- settlement reference resolvedlevel=info ref=st_0041 latency_ms=12 rev=4f82c114:08:40
- connection pool near capacitylevel=warn pool.used=38 pool.max=50 rev=4f82c114:08:39
- webhook deliveredlevel=info event=payment.succeeded status=200 rev=4f82c114:08:38
- intent createdlevel=info intent=pi_3vTn amount=912.40 rev=4f82c114:08:38
Saturation — failing gate
Gate threshold 70% · rollout paused- Comfortable≤ 50
- Gate limit≤ 70
- Breach≤ 90
- Critical≤ 100
Deploy frequency
by dayInfrastructure spend
- Compute43.0%
- Databases26.2%
- Storage15.9%
- Network egress9.8%
- Observability5.1%
Environment drift — notify-worker
- Environment
- production
- Drift detected
- 2 keys
- MAX_RETRIES
- declared 3 · actual 5
- QUEUE_PREFETCH
- declared 10 · actual 32
- Changed by
- manual console edit
- Detected
- 41 min ago
- Resolution
- Reconcile or adopt
Interface states
UI statesNo services yet
Define a service to start deploying it across environments.
Add serviceEmpty stateRollout paused — gate failed
Database saturation reached 78% against a 70% gate. Traffic is held at 25% and auto-rollback is armed but not yet triggered.
How it is put together.
The reconciler is the only thing that writes to infrastructure. The UI and CLI both go through the same declarative API, so there is no privileged path.
- 01
Control Plane UI
Service catalogue, rollout control, logs, monitoring and environment views.
- Next.js
- React
- Streaming logs
- 02
Platform API
Declarative service definitions, RBAC and audit logging. CLI uses the same API.
- Go
- gRPC
- REST
- RBAC
- 03
Reconciler
Continuously converges actual infrastructure toward declared state and reports drift.
- Go
- Control loop
- Idempotent apply
- 04
Deployment Engine
Progressive rollouts, canary analysis, health gates and automatic rollback.
- Canary analysis
- Traffic shifting
- State machine
- 05
Observability Pipeline
Logs, metrics, traces and deploy events joined on one timeline.
- OpenTelemetry
- ClickHouse
- Loki-style index
- 06
Infrastructure
Container orchestration, managed databases, queues and object storage.
- Kubernetes
- Docker
- Terraform
- Cloud
What the product does.
The capability set the demonstration is built around.
Services
Service catalogue with ownership, dependencies, SLOs and runtime configuration.
Deployments
Progressive rollouts with canary analysis, health gates and automatic rollback.
Environments
Environment promotion with drift detection and per-environment overrides.
Logs
Structured log search across services with trace correlation.
Monitoring
SLO tracking with error budgets and burn-rate alerting.
APIs
Platform API and CLI so everything in the UI is scriptable.
Infrastructure health
Cluster, database and queue health with capacity headroom.
Challenges, and the MaatX approach.
The problems that actually decide whether a system like this survives production — and how we address each one.
A rollout that looks healthy at 5% fails at 100%
Gates evaluate per stage with a minimum observation window, and saturation is measured on shared dependencies rather than only on the new replicas — which is where percentage-dependent failures actually show up.
Rollback under pressure is the least reliable moment to improvise
The previous healthy revision is always identified and pre-validated. Rollback is a single pre-computed action with the same gates, so it is the boring path rather than the emergency one.
Manual console edits silently diverge from the declared state
The reconciler compares continuously and reports drift with the key, the declared value and the actual value — then offers to reconcile or adopt, instead of overwriting someone's emergency fix without asking.
Correlating a regression to a change spans three tools
Deploy events, config changes, logs and metrics are written to a shared timeline keyed by service and revision, so the question 'what changed when this started' is one query.
Platform APIs become a privileged backdoor around the UI's controls
There is one API. The UI and CLI are both clients of it, subject to the same RBAC and the same audit log, so scripted changes carry the same controls as clicked ones.
Log volume at 84 services makes full retention unaffordable
Logs are sampled by level with full retention around deploys and incidents, keeping fidelity where investigation happens and cost bounded everywhere else.
The stack behind it.
Platform API
- Go
- gRPC
- Protocol Buffers
- REST
- RBAC
- Audit log
- Declarative service schema
Reconciler
- Go
- Control loop
- Idempotent apply
- Desired-state diffing
- Drift detection
- Leader election
- Exponential backoff
Progressive delivery
- Canary analysis
- Traffic shifting
- Health gates
- Rollout state machine
- Baseline comparison
- Automatic rollback
- Minimum observation windows
Observability pipeline
- OpenTelemetry
- Prometheus
- ClickHouse
- Loki-style log index
- Trace correlation
- Level-based log sampling
- SLO burn-rate alerting
Control-plane state
- PostgreSQL
- Redis
- Object storage
- Append-only deploy events
- Optimistic concurrency
- Encrypted secret store
Runtime infrastructure
- Kubernetes
- Docker
- Terraform
- Container registry
- Horizontal autoscaling
- Managed databases
- Message queues
Console & CLI
- Next.js
- React
- TypeScript
- Tailwind CSS
- Server-sent log streaming
- Command palette
- Go CLI on the same API
How it grows with the business.
The same system at three stages. Most products should not start at the third — but the architecture should not have to be thrown away to get there.
A service catalogue and reliable deploys for a handful of services.
- Service definitions and environments
- Deploy with health checks and manual rollback
- Log search across services
- Basic monitoring
Progressive delivery with automated gates and drift detection.
- Canary rollouts with health gates
- Automatic rollback on gate failure
- Continuous reconciliation and drift reporting
- SLOs with error budgets
Platform for many teams with cost and policy controls.
- Cost attribution per service and deploy
- Preview environments per pull request
- Policy gates on architectural rules
- Capacity forecasting from load trends
Where it could go next.
Directions this system would extend into.
- 01
Cost attribution per service, environment and deploy
- 02
Preview environments created per pull request and torn down on merge
- 03
Dependency-aware deploy ordering across services
- 04
Policy gates that block deploys violating architectural rules
- 05
Capacity forecasting from historical load and growth trend

Running infrastructure where a deploy needs to prove itself before it takes traffic?
We built ATLAS CONTROL to work through exactly this. Tell us where you are and we will tell you what we would do differently for your constraints.